STATA to R
1 Introduction
With this page, we want to help students, researchers, and practitioners that are used to STATA to include R in their analytic toolbox. Likewise, we present some of the most used panel analysis’ technics showing the potential of different approaches.
This page is not a statistic textbook; we won’t discuss the statistic assumptions or mathematical derivations behind the techniques. We are assuming two things. First, the reader has enough statistical background to understand the strengths and limitations of each model. Second, the user knows more STATA than R. Therefore, our STATA code will have fewer comments than the R code. Navigate among the topics covered here using the top menu.
We value both statistical packages and think that nowadays a researcher/student/practitioner should be able to conduct analysis on both.
Here are some textbooks that we recommend for panel analysis:
- Allison, Paul. 2009. Fixed Effects Regression Models. Thousand Oaks, Ca.: Sage Publications.
- Finkel, Steven E. 1995. Causal Analysis with Panel Data. Thousand Oaks, Ca.: Sage Publications. (Royalties donated to University of Pittsburgh Chapter, Pi Sigma Alpha, Political Science Undergraduate Honor Society).
- Andreß, Golsch, and Schmidt. 2013. Applied Panel Data Analysis for Economic and Social Surveys. Heidelberg: Springer-Verlag.
3 Basics
Code:
STATA and R code will be in grey boxes like this:
Notes about R, and R features will also be in boxes like this:
Sometimes the output has warnings. We are not showing those here. In general, you should not worry about warnings. However, be wary about errors. When the output shows “error” that means something is wrong and R didn’t execute the code.
3.1 R packages and data sets
We are going to use the following packages:
For data managment:
For modeling:
Here is some resources to learn the most basic steps:
Let’s install all our packages at once.
- Packages are grouped using “c()” and separated by “,”. It is possible to install one by one, or several at the same time.
- You need to install a package only one time.
- If you want to know which packages you have installed use the code below (Becareful, the output could be long.):
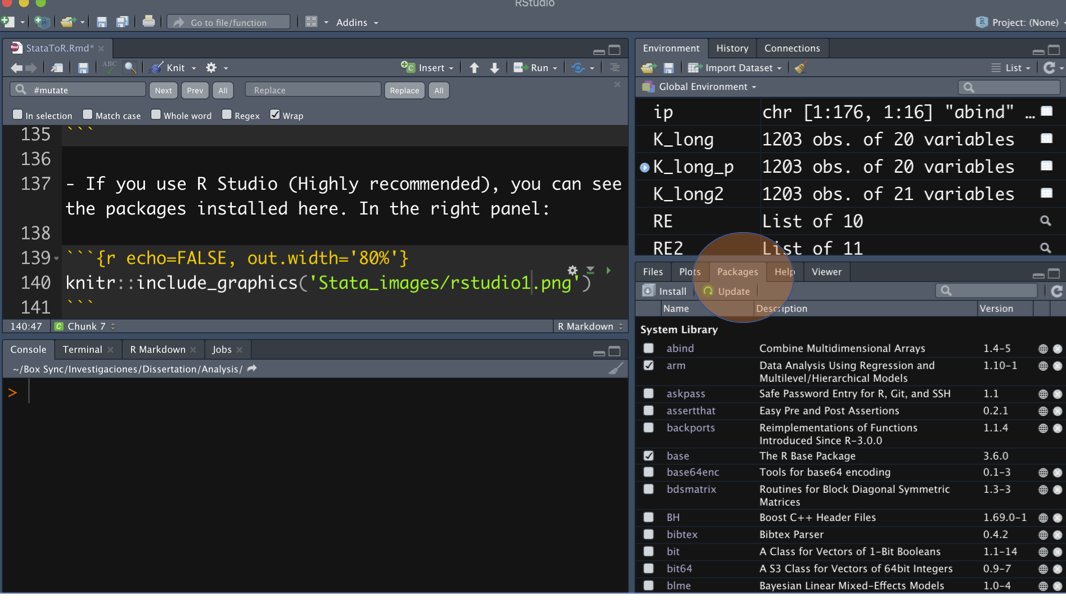
- You can find a menu to install and browse your package at the right panel in R Studio (Highly recommended!!).