Modelos Lineales
Seguimos usando la data del artículo:
Holland, Alisha C., and José Incio. 2018. “Imperfect Recall: The Politics of Subnational Office Removals.” Comparative Political Studies: 0010414018797939.
library(rio)
recall<-import("https://github.com/jincio/Imperfect_recall/raw/master/recalldataset.dta")
0.1 Modelo Lineal
##
## Call:
## lm(formula = enp ~ indigenous + execution, data = recall)
##
## Residuals:
##     Min      1Q  Median      3Q     Max
## -3.5745 -1.0383 -0.2044  0.8683  6.9390
##
## Coefficients:
##             Estimate Std. Error t value Pr(>|t|)
## (Intercept)  4.81361    0.14090  34.163  < 2e-16 ***
## indigenous   0.49014    0.06096   8.041 1.11e-15 ***
## execution   -0.87338    0.18216  -4.795 1.68e-06 ***
## ---
## Signif. codes:  0 '***' 0.001 '**' 0.01 '*' 0.05 '.' 0.1 ' ' 1
##
## Residual standard error: 1.422 on 4875 degrees of freedom
##   (1680 observations deleted due to missingness)
## Multiple R-squared:  0.01875,    Adjusted R-squared:  0.01834
## F-statistic: 46.57 on 2 and 4875 DF, p-value: < 2.2e-16##
## Call:
## lm(formula = enp ~ indigenous + execution * incumbent, data = recall)
##
## Residuals:
## Min 1Q Median 3Q Max
## -3.6358 -1.0178 -0.1940 0.8399 6.7714
##
## Coefficients:
## Estimate Std. Error t value Pr(>|t|)
## (Intercept) 4.88294 0.15498 31.508 < 2e-16 ***
## indigenous 0.35990 0.06095 5.905 3.78e-09 ***
## execution -0.74652 0.20129 -3.709 0.000211 ***
## incumbent -0.47384 0.34205 -1.385 0.166017
## execution:incumbent -0.20172 0.44427 -0.454 0.649816
## ---
## Signif. codes: 0 '***' 0.001 '**' 0.01 '*' 0.05 '.' 0.1 ' ' 1
##
## Residual standard error: 1.4 on 4873 degrees of freedom
## (1680 observations deleted due to missingness)
## Multiple R-squared: 0.04873, Adjusted R-squared: 0.04795
## F-statistic: 62.41 on 4 and 4873 DF, p-value: < 2.2e-160.2 Robust Estandard Errors
## Loading required package: zoo##
## Attaching package: 'zoo'## The following objects are masked from 'package:base':
##
## as.Date, as.Date.numeric##
## t test of coefficients:
##
## Estimate Std. Error t value Pr(>|t|)
## (Intercept) 4.882936 0.158289 30.8483 < 2.2e-16 ***
## indigenous 0.359900 0.061191 5.8816 4.334e-09 ***
## execution -0.746516 0.205095 -3.6399 0.0002756 ***
## incumbent -0.473845 0.320293 -1.4794 0.1390958
## execution:incumbent -0.201720 0.410768 -0.4911 0.6233912
## ---
## Signif. codes: 0 '***' 0.001 '**' 0.01 '*' 0.05 '.' 0.1 ' ' 1En este post damos más detalles de cómo agregar los robust standard errors en el resultados de nuestro modelo. Aquí
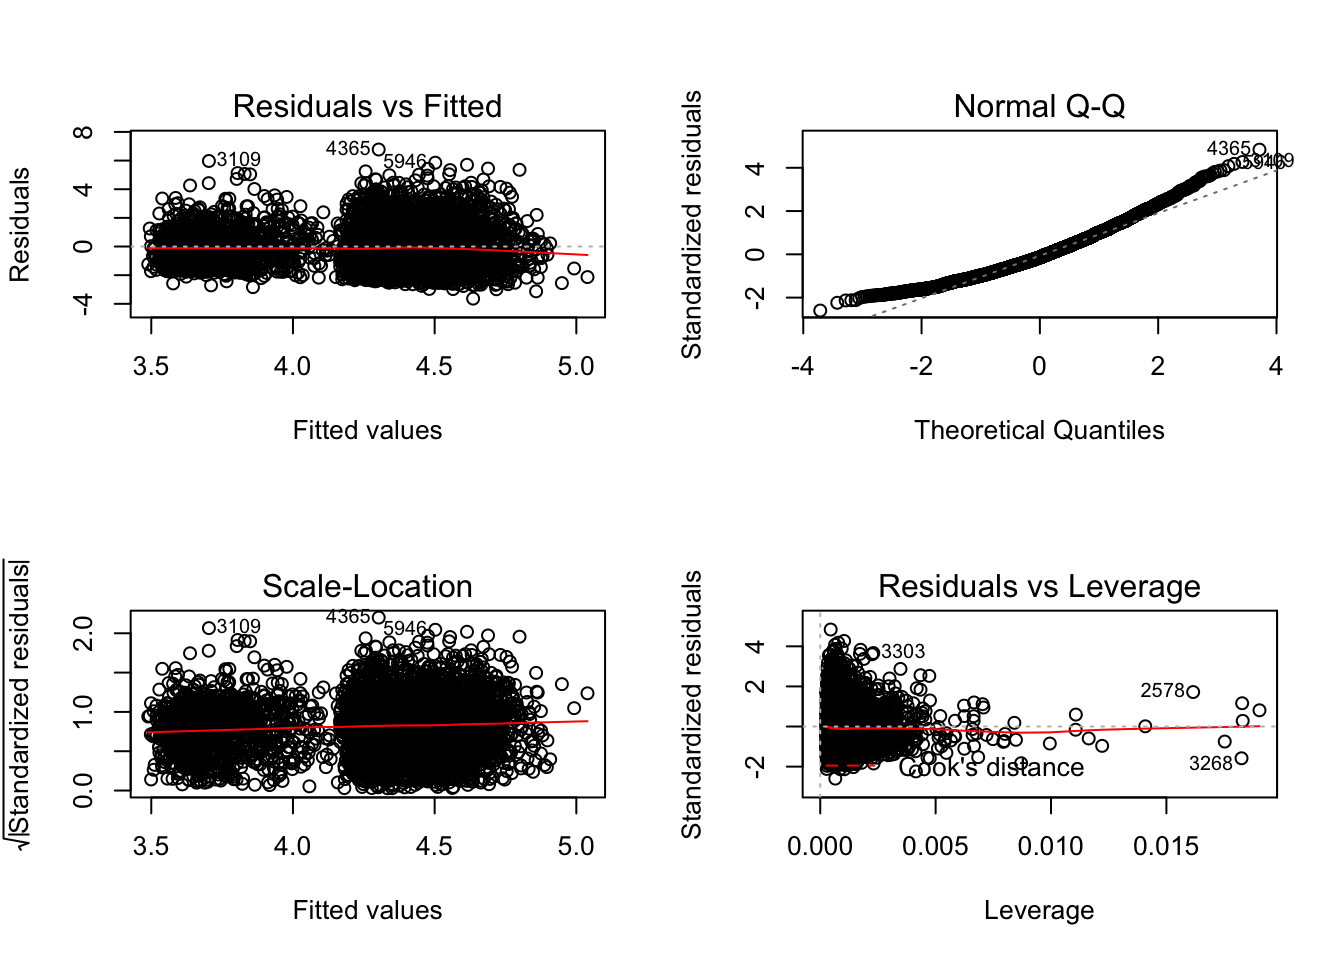
0.3 Diagnostico
0.3.1 Valores influyentes
## Loading required package: carData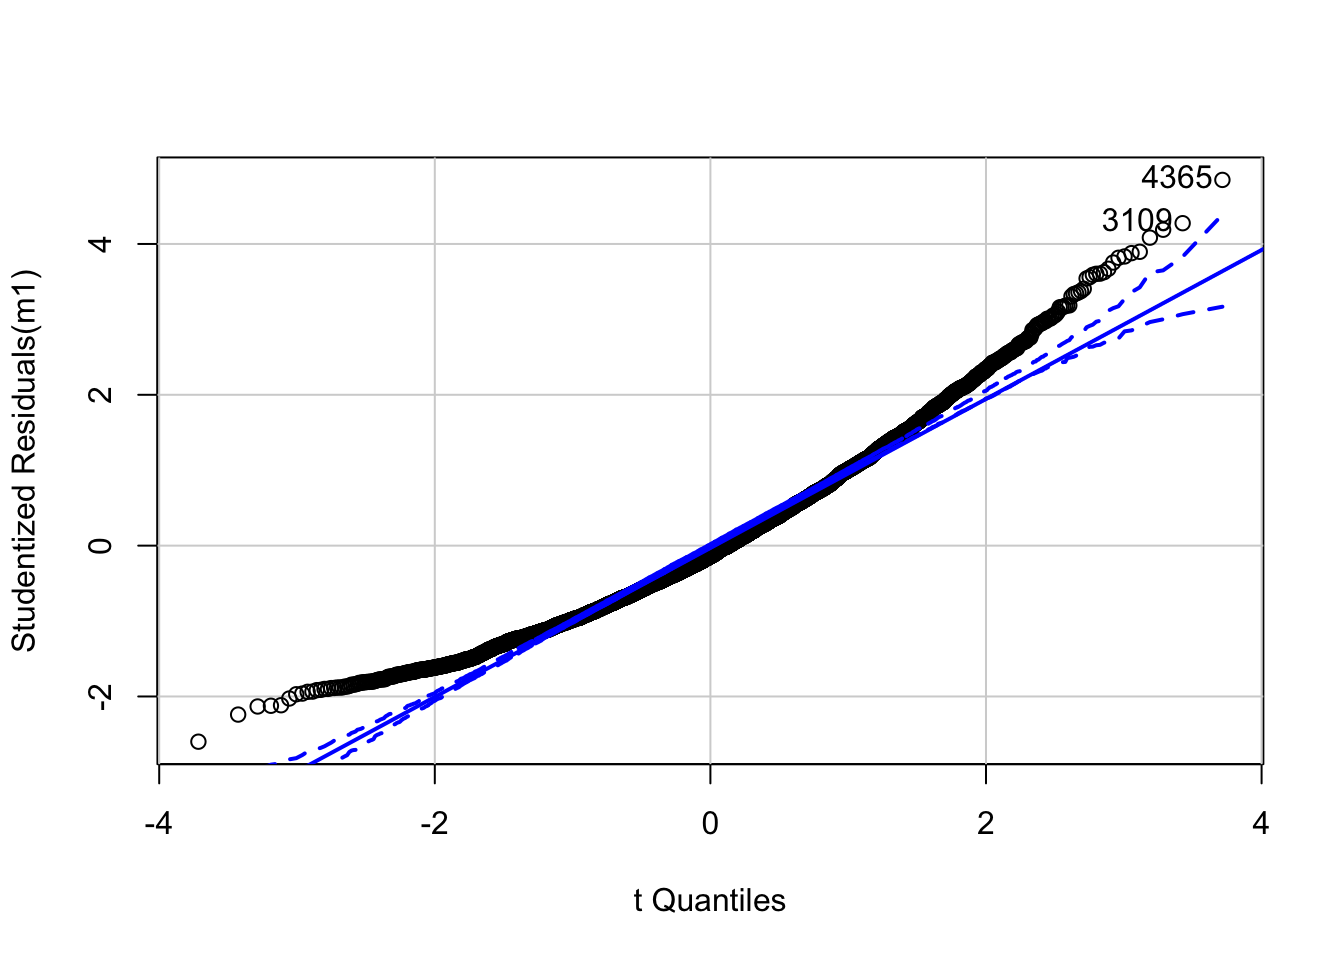
## [1] 3109 4365## rstudent unadjusted p-value Bonferroni p
## 4365 4.849204 1.2782e-06 0.00623490.3.2 Multicolinealidad
##          indigenous           execution           incumbent
##            1.035507            1.264523           47.105976
## execution:incumbent
## 47.641679## indigenous execution incumbent
## FALSE FALSE TRUE
## execution:incumbent
## TRUE0.3.3 Normalidad de los residuos
Creamos un objeto que contenga los valores residuales del modelo, con la finalidad de probar si los residuos tienen una distribución normal. De no tenerla, sería problemático al momento de inferir.
##
##  Shapiro-Francia normality test
##
## data:  res
## W = 0.97099, p-value < 2.2e-16##
## Anderson-Darling normality test
##
## data: res
## A = 31.417, p-value < 2.2e-160.3.4 Homocedasticidad
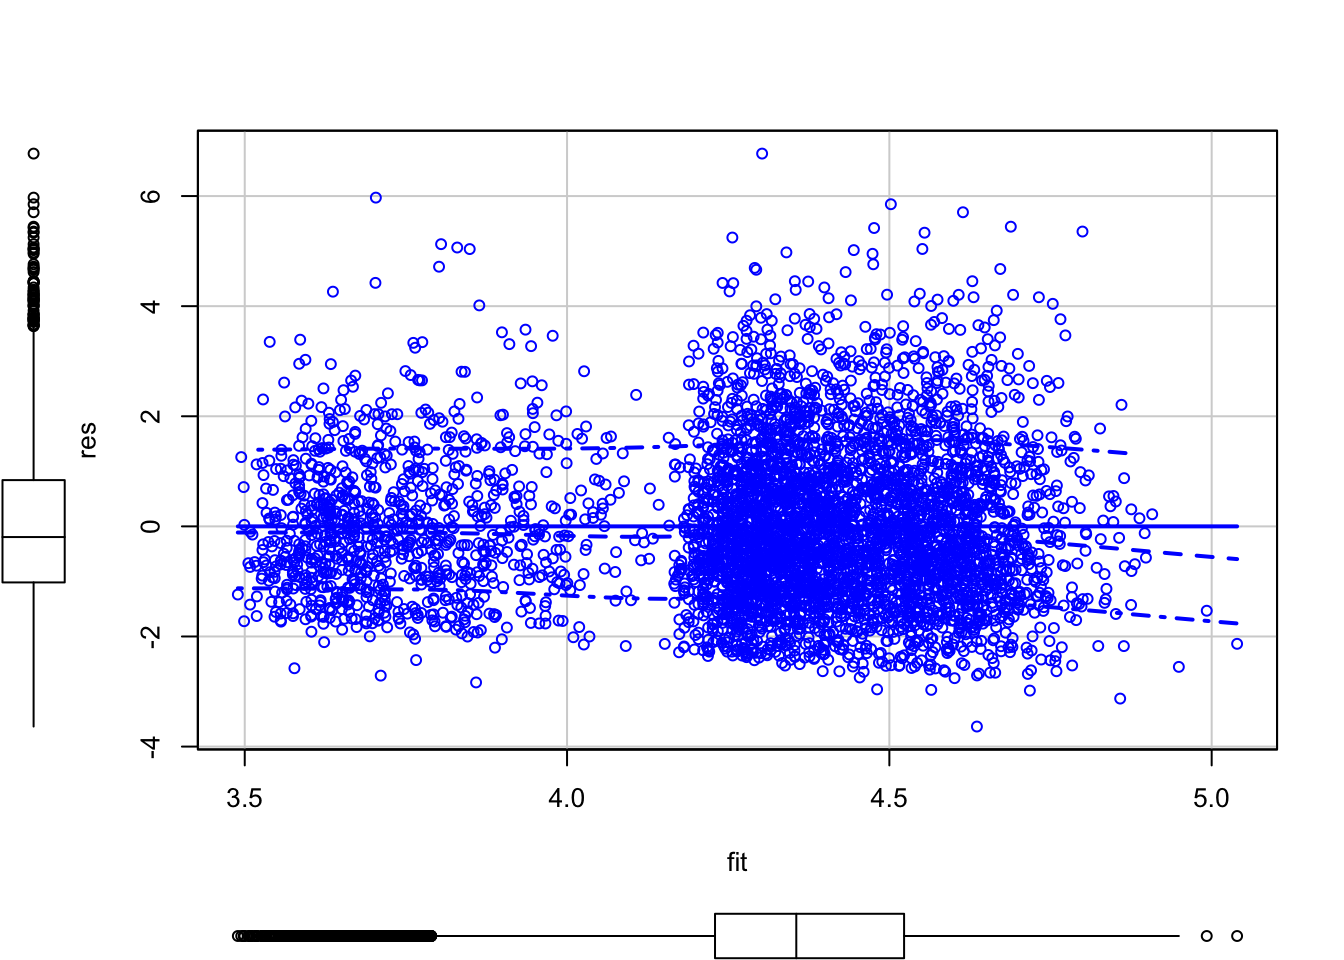
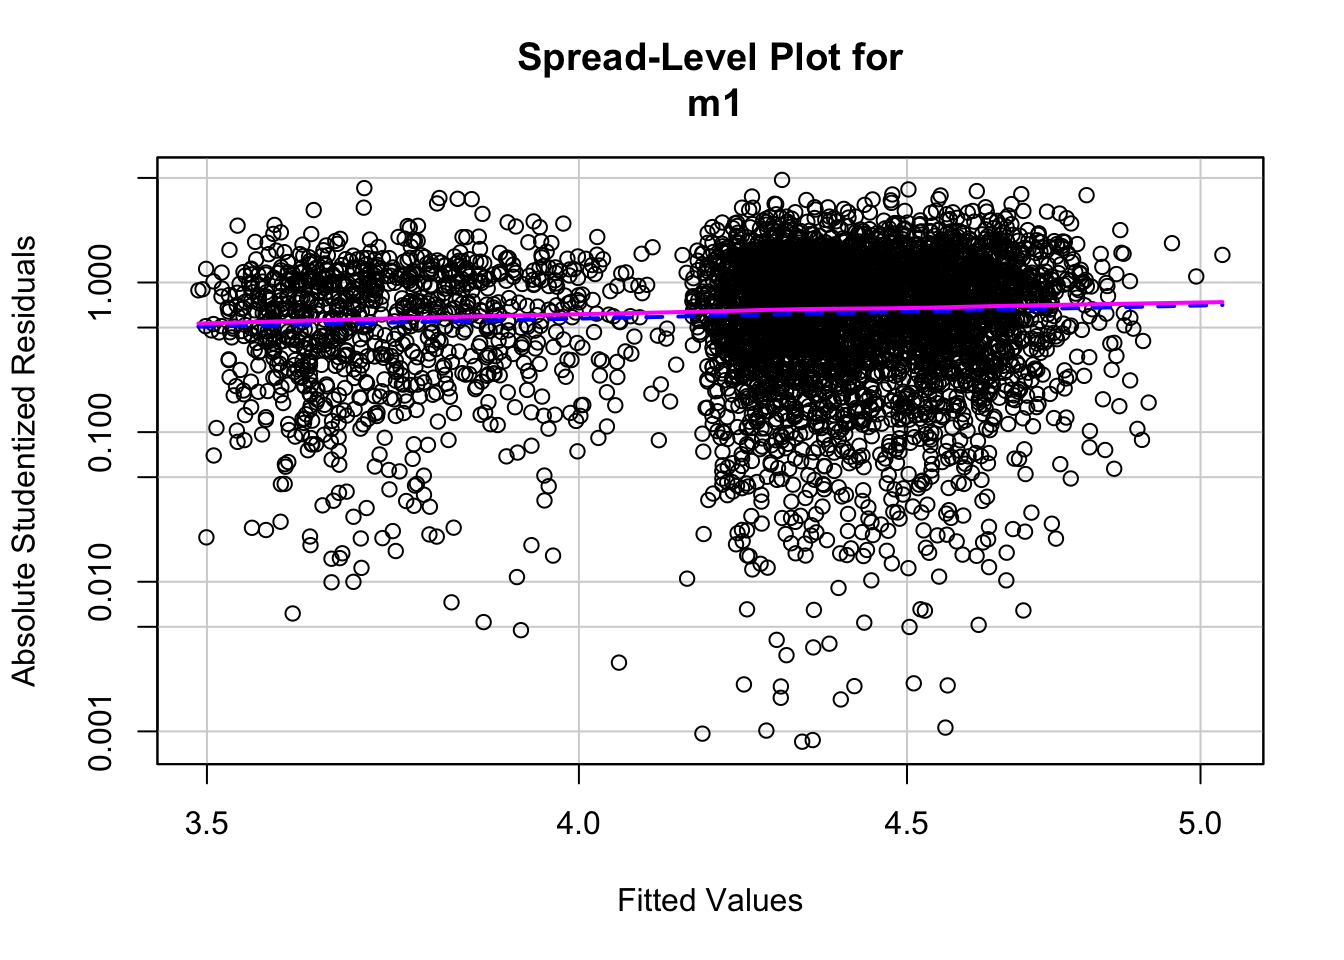
##
## Suggested power transformation: 0.09177957##
## studentized Breusch-Pagan test
##
## data: m1
## BP = 28.356, df = 4, p-value = 1.056e-05